CENTRO METEOROLOGICO DE TALCAHUANO weather
Latitude S 36° 42' 29" Longitude W 73° 06' 46" Elevation 3 m
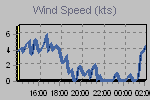
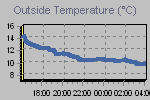
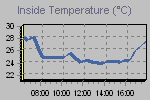
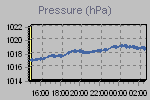
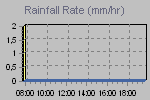
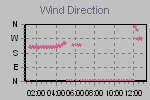
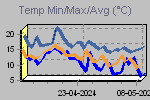
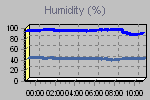
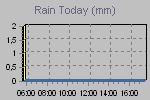
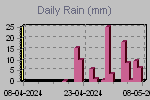
These graphs present the temperature, pressure, rainfall, and wind speed trends for the last 12 hours.
The thumbnail graphs are sampled every ten minutes. Click on a thumbnail to display the corresponding larger graph in the panel above it. The large graphs are sampled every minute.
 |
||||
| Click on a thumbnail to show a large graph in the panel above. | ||||
 |
 |
 |
 |
 |
 |
 |
 |
 |
 |
| :now::gauges::today::yesterday::this month::this year::records::monthly records::trends::forum: | ||||
Page updated 14-07-2026 7:40:00
powered by
Cumulus v1.9.4 (1097)