
Page 159 - Boletin Estadistico 2022
P. 159
PÁG. 159
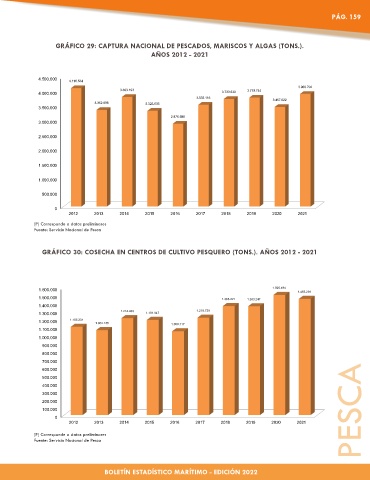
GRÁFICO 29: CAPTURA NACIONAL DE PESCADOS, MARISCOS Y ALGAS (TONS.).
AÑOS 2012 - 2021
4.500.000 4.110.534
3.909.702
3.803.193 3.779.744
4.000.000 3.733.639
3.533.116 3.457.622
3.352.898 3.323.035
3.500.000
2.876.585
3.000.000
2.500.000
2.000.000
1.500.000
1.000.000
500.000
0
2012 2013 2014 2015 2016 2017 2018 2019 2020 2021
(P) Corresponde a datos preliminares
Fuente: Servicio Nacional de Pesca
GRÁFICO 30: COSECHA EN CENTROS DE CULTIVO PESQUERO (TONS.). AÑOS 2012 - 2021
1.600.000 1.505.494 1.455.294
1.500.000 1.365.221 1.363.247
1.400.000
1.214.439 1.219.739
1.300.000 1.191.947
1.200.000 1.105.231 1.064.138 1.050.117
1.100.000
1.000.000
900.000
800.000
700.000
600.000
500.000
400.000
300.000
200.000
100.000 PESCA
0
2012 2013 2014 2015 2016 2017 2018 2019 2020 2021
(P) Corresponde a datos preliminares
Fuente: Servicio Nacional de Pesca
BOLETÍN ESTADÍSTICO MARÍTIMO - EDICIÓN 2022