
Page 47 - ALTA_Boletin Estadistico 2021
P. 47
PÁG. 47
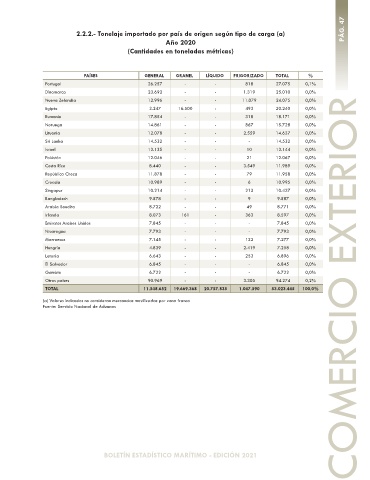
2.2.2.- Tonelaje importado por país de origen según tipo de carga (a)
Año 2020
(Cantidades en toneladas métricas)
PAÍSES GENERAL GRANEL LÍQUIDO FRIGORIZADO TOTAL %
Portugal 26.257 - - 818 27.075 0,1%
Dinamarca 23.692 - - 1.319 25.010 0,0%
Nueva Zelandia 12.996 - - 11.079 24.075 0,0%
Egipto 3.247 16.500 - 493 20.240 0,0%
Rumania 17.854 - - 318 18.171 0,0%
Noruega 14.861 - - 867 15.728 0,0%
Lituania 12.078 - - 2.559 14.637 0,0%
Sri Lanka 14.532 - - - 14.532 0,0%
Israel 13.135 - - 10 13.144 0,0%
Pakistán 12.046 - - 21 12.067 0,0%
Costa Rica 8.440 - - 3.549 11.989 0,0%
República Checa 11.878 - - 79 11.958 0,0%
Croacia 10.989 - - 6 10.995 0,0%
Singapur 10.214 - - 213 10.427 0,0%
Bangladesh 9.578 - - 9 9.587 0,0%
Arabia Saudita 8.722 - - 49 8.771 0,0%
Irlanda 8.073 161 - 363 8.597 0,0%
Emiratos Arabes Unidos 7.845 - - - 7.845 0,0%
Nicaragua 7.793 - - - 7.793 0,0%
Marruecos 7.145 - - 132 7.277 0,0%
Hungria 4.839 - - 2.419 7.258 0,0%
Letonia 6.643 - - 253 6.896 0,0%
El Salvador 6.845 - - - 6.845 0,0%
Gambia 6.722 - - - 6.722 0,0%
Otros países 90.969 - - 3.305 94.274 0,2%
TOTAL 11.548.652 19.669.368 20.757.835 1.047.590 53.023.445 100,0% COMERCIO EXTERIOR
(a) Valores indicados no consideran mercancías movilizadas por zona franca
Fuente: Servicio Nacional de Aduanas
BOLETÍN ESTADÍSTICO MARÍTIMO - EDICIÓN 2021