
Page 44 - Boletín Estadístico Portuario
P. 44
BOLETÍN ESTADÍSTICO PORTUARIO
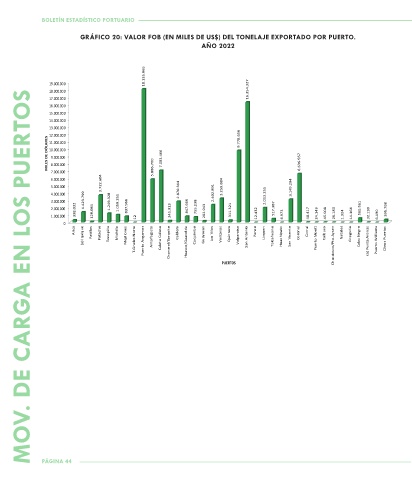
GRÁFICO 20: VALOR FOB (EN MILES DE US$) DEL TONELAJE EXPORTADO POR PUERTO.
AÑO 2022
18.135.065
19.000.000
18.000.000 16.354.327
MOV. DE CARGA EN LOS PUERTOS
17.000.000
16.000.000
15.000.000
14.000.000
13.000.000
12.000.000 9.778.656
MILES DE DÓLARES 10.000.000 7.083.466 6.636.557
11.000.000
9.000.000
8.000.000
7.000.000
6.000.000 5.886.700
5.000.000 3.722.604 2.870.314 3.259.884 3.149.294
4.000.000 2.402.891 2.012.255
3.000.000 1.423.799 1.249.328 1.059.251
2.000.000 338.032 128.084 837.966 245.913 847.666 755.238 202.943 311.321 517.387 590.561 395.798
1.000.000 12 12.432 4.973 48.417 24.143 45.008 26.183 1.324 14.164 32.130 6.190
0
Arica Patillos Patache Michilla Caldera Los Vilos Penco Lirquen Coronel Corral Calbuco Natales
(a) Iquique Tocopilla Mejillones T.Gneles Norte Puerto Angamos Antofagasta Caleta Coloso Chanaral/Barquito Huasco/Guacolda Coquimbo Guayacan Ventanas Quintero Valparaiso San Antonio Talcahuano Huachipato San Vicente Puerto Montt Chacabuco/Pto.Aysen Gregorio Cabo Negro (a) Punta Arenas Puerto Williams Otros Puertos
PUERTOS
PÁGINA 44