Page 53 - Boletin Estadistico 2022
P. 53

PÁG. 53


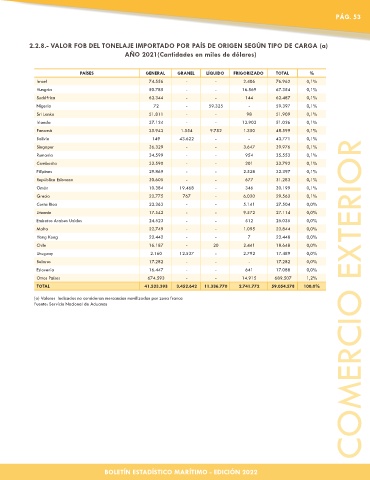
           2.2.8.- VALOR FOB DEL TONELAJE IMPORTADO POR PAÍS DE ORIGEN SEGÚN TIPO DE CARGA (a)
                                          AÑO 2021(Cantidades en miles de dólares)


                           PAÍSES                GENERAL    GRANEL   LÍQUIDO  FRIGORIZADO   TOTAL      %
             Israel                                74.556      -         -        2.406      76.962   0,1%
             Hungria                               50.785      -         -        16.569     67.354   0,1%
             Sudáfrica                             62.344      -         -         144       62.487   0,1%
             Nigeria                                72         -       59.325       -        59.397   0,1%
             Sri Lanka                             51.811      -         -         98        51.909   0,1%
             Irlanda                               37.124      -         -        13.903     51.026   0,1%
             Panamá                                35.943    1.554     9.752      1.350      48.599   0,1%
             Bolivia                                149      43.622      -          -        43.771   0,1%
             Singapur                              36.329      -         -        3.647      39.976   0,1%
             Rumania                               34.599      -         -         954       35.553   0,1%
             Cambodia                              33.590      -         -         201       33.792   0,1%
             Filipinas                             29.869      -         -        2.528      32.397   0,1%
             República Eslovaca                    30.605      -         -         677       31.283   0,1%
             Omán                                  10.384    19.468      -         346       30.199   0,1%
             Grecia                                22.775     767        -        6.020      29.563   0,1%
             Costa Rica                            22.363      -         -        5.141      27.504   0,0%
             Lituania                              17.542      -         -        9.572      27.114   0,0%
             Emiratos Arabes Unidos                24.523      -         -         512       25.035   0,0%
             Malta                                 22.749      -         -        1.095      23.844   0,0%
             Hong Kong                             23.442      -         -          7        23.448   0,0%
             Chile                                 16.187      -        20        2.441      18.648   0,0%
             Uruguay                               2.160     12.537      -        2.792      17.489   0,0%
             Belarus                               17.282      -         -          -        17.282   0,0%
             Eslovenia                             16.447      -         -         641       17.088   0,0%
             Otros Países                         674.593      -         -        14.915    689.507   1,2%
             TOTAL                               41.523.393    3.452.642   11.336.770    2.741.772    59.054.578   100,0%

            (a) Valores  indicados no consideran mercancías movilizadas por zona franca                                 COMERCIO EXTERIOR
            Fuente: Servicio Nacional de Aduanas


                                    BOLETÍN ESTADÍSTICO MARÍTIMO - EDICIÓN 2022
   48   49   50   51   52   53   54   55   56   57   58