
Page 79 - ALTA_Boletin Estadistico 2021
P. 79
PÁG. 79
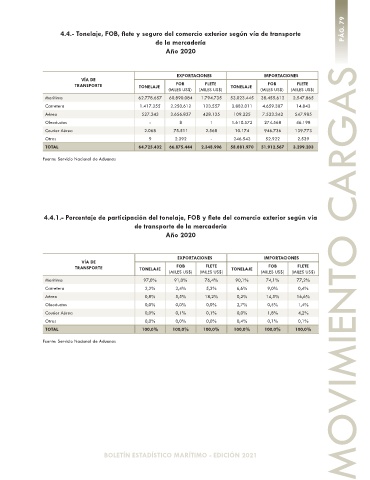
4.4.- Tonelaje, FOB, flete y seguro del comercio exterior según vía de transporte
de la mercadería
Año 2020
EXPORTACIONES IMPORTACIONES
VÍA DE
TRANSPORTE TONELAJE FOB FLETE TONELAJE FOB FLETE
(MILES US$) (MILES US$) (MILES US$) (MILES US$)
Marítima 62.778.657 60.890.084 1.794.735 53.023.445 38.455.612 2.547.865
Carretera 1.417.355 2.250.612 123.557 3.882.011 4.659.387 14.843
Aérea 527.343 3.656.837 428.135 109.225 7.523.342 547.985
Oleoductos - 8 1 1.610.572 274.568 46.198
Courier Aérea 2.068 75.511 2.568 10.174 946.736 139.773
Otras 9 2.392 - 246.543 52.922 2.539
TOTAL 64.725.432 66.875.444 2.348.996 58.881.970 51.912.567 3.299.203
Fuente: Servicio Nacional de Aduanas
4.4.1.- Porcentaje de participación del tonelaje, FOB y flete del comercio exterior según vía
de transporte de la mercadería
Año 2020
EXPORTACIONES IMPORTACIONES
VÍA DE
TRANSPORTE TONELAJE FOB FLETE TONELAJE FOB FLETE
(MILES US$) (MILES US$) (MILES US$) (MILES US$) MOVIMIENTO CARGAS
Marítima 97,0% 91,0% 76,4% 90,1% 74,1% 77,2%
Carretera 2,2% 3,4% 5,3% 6,6% 9,0% 0,4%
Aérea 0,8% 5,5% 18,2% 0,2% 14,5% 16,6%
Oleoductos 0,0% 0,0% 0,0% 2,7% 0,5% 1,4%
Courier Aérea 0,0% 0,1% 0,1% 0,0% 1,8% 4,2%
Otras 0,0% 0,0% 0,0% 0,4% 0,1% 0,1%
TOTAL 100,0% 100,0% 100,0% 100,0% 100,0% 100,0%
Fuente: Servicio Nacional de Aduanas
BOLETÍN ESTADÍSTICO MARÍTIMO - EDICIÓN 2021