
Page 72 - ALTA_Boletin Estadistico 2021
P. 72
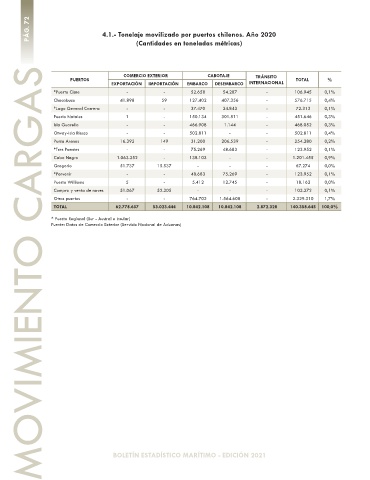
PÁG. 72                 4.1.- Tonelaje movilizado por puertos chilenos. Año 2020


                                              (Cantidades en toneladas métricas)


               MOVIMIENTO CARGAS
                                          COMERCIO EXTERIOR               CABOTAJE    TRÁNSITO
                        PUERTOS                                                                    TOTAL     %
                                      EXPORTACIÓN  IMPORTACIÓN  EMBARCO  DESEMBARCO  INTERNACIONAL
                   *Puerto Cisne           -            -        52.658    54.287         -        106.945   0,1%
                   Chacabuco             41.898        59       127.402    407.356        -        576.715   0,4%
                   *Lago General Carrera   -            -        37.470    34.843         -        72.313   0,1%
                   Puerto Natales          1            -       150.134    301.511        -        451.646   0,3%
                   Isla Guarello           -            -       466.908     1.144         -        468.052   0,3%
                   Otway-Isla Riesco       -            -       502.811      -            -        502.811   0,4%
                   Punta Arenas          16.392        149       31.200    206.539        -        254.280   0,2%
                   *Tres Puentes           -            -        75.269    48.683         -        123.952   0,1%
                   Cabo Negro           1.063.352       -       138.103      -            -       1.201.455   0,9%
                   Gregorio              51.737       15.537       -         -            -        67.274   0,0%
                   *Porvenir               -            -        48.683    75.269         -        123.952   0,1%
                   Puerto Williams         5            -        5.412     12.745         -        18.162   0,0%
                   Compra y venta de naves   51.067    52.305      -         -            -        103.372   0,1%
                   Otros puertos           -            -       764.702    1.564.608      -       2.329.310   1,7%
                   TOTAL                62.778.657    53.023.444    10.842.108    10.842.108    2.872.328    140.358.645  100,0%
                  * Puerto Regional (Sur - Austral e Insular)
                  Fuente: Datos de Comercio Exterior (Servicio Nacional de Aduanas)


                                      BOLETÍN ESTADÍSTICO MARÍTIMO - EDICIÓN 2021