
Page 32 - Boletín Estadístico Marítimo
P. 32
BOLETÍN ESTADÍSTICO MARÍTIMO
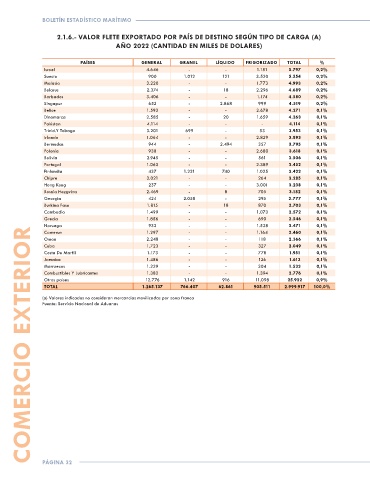
2.1.6.- VALOR FLETE EXPORTADO POR PAÍS DE DESTINO SEGÚN TIPO DE CARGA (A)
AÑO 2022 (CANTIDAD EN MILES DE DOLARES)
PAÍSES GENERAL GRANEL LÍQUIDO FRIGORIZADO TOTAL %
Israel 4.646 - - 1.151 5.797 0,2%
Suecia 900 1.012 121 3.520 5.554 0,2%
Malasia 3.220 - - 1.773 4.993 0,2%
Belarus 2.374 - 18 2.296 4.689 0,2%
Barbados 3.406 - - 1.174 4.580 0,2%
Singapur 652 - 2.868 999 4.519 0,2%
Belice 1.593 - - 2.678 4.271 0,1%
Dinamarca 2.585 - 20 1.659 4.263 0,1%
Pakistan 4.114 - - - 4.114 0,1%
Trinid.Y Tobago 3.201 699 - 53 3.953 0,1%
Irlanda 1.064 - - 2.829 3.893 0,1%
Bermudas 944 - 2.494 357 3.795 0,1%
Polonia 938 - - 2.680 3.618 0,1%
Bolivia 2.945 - - 561 3.506 0,1%
Portugal 1.063 - - 2.389 3.452 0,1%
Finlandia 437 1.221 740 1.025 3.422 0,1%
Chipre 3.021 - - 264 3.285 0,1%
Hong Kong 237 - - 3.001 3.238 0,1%
Bosnia Hezgvina 2.469 - 8 705 3.182 0,1%
Georgia 424 2.058 - 295 2.777 0,1%
Burkina Faso 1.815 - 18 870 2.703 0,1%
Cambodia 1.499 - - 1.073 2.572 0,1%
Grecia 1.856 - - 690 2.546 0,1%
Noruega 933 - - 1.538 2.471 0,1%
COMERCIO EXTERIOR
Camerun 1.297 - - 1.164 2.460 0,1%
Oman 2.248 - - 118 2.366 0,1%
Cuba 1.723 - - 327 2.049 0,1%
Costa De Marfil 1.173 - - 778 1.951 0,1%
Jamaica 1.486 - - 126 1.613 0,1%
Marruecos 1.229 - - 304 1.533 0,1%
Combustibles Y Lubricantes 1.382 - - 1.394 2.776 0,1%
Otros países 12.776 1.142 916 11.098 25.932 0,9%
TOTAL 1.265.137 766.407 62.861 905.511 2.999.917 100,0%
(a) Valores indicados no consideran mercancias movilizadas por zona franca
Fuente: Servicio Nacional de Aduanas
PÁGINA 32