
Page 67 - Boletín Estadístico Portuario
P. 67
EDICIÓN 2023
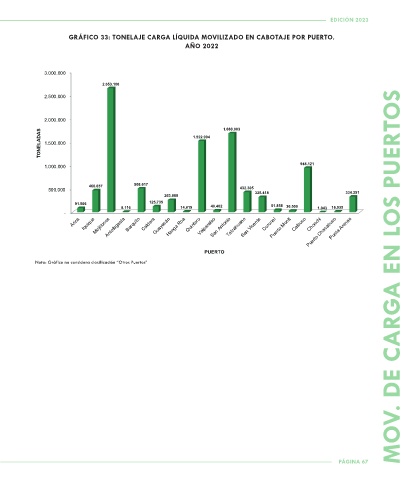
GRÁFICO 33: TONELAJE CARGA LÍQUIDA MOVILIZADO EN CABOTAJE POR PUERTO.
AÑO 2022
3.000.000
2.653.100
2.500.000
2.000.000 1.688.003
TONELADAS 1.500.000 1.522.904
1.000.000 948.121
468.857 508.617
500.000 432.305 325.418 334.251
263.888
91.506 125.735 51.858 36.500
8.116 14.619 40.402 1.043 16.935
-
Chonchi
Arica Iquique Mejillones Antofagasta Barquito Caldera Guayacán Hanga Roa Quintero Valparaíso San Antonio Talcahuano San Vicente Coronel Puerto Montt Calbuco Puerto Chacabuco Punta Arenas
PUERTO
Nota: Gráfico no considera clasificación “Otros Puertos” MOV. DE CARGA EN LOS PUERTOS
PÁGINA 67