
Page 56 - Boletín Estadístico Marítimo
P. 56
BOLETÍN ESTADÍSTICO MARÍTIMO
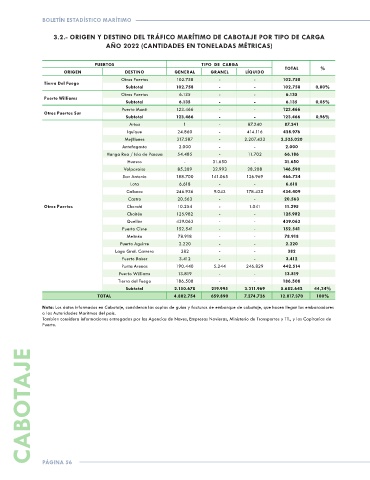
3.2.- ORIGEN Y DESTINO DEL TRÁFICO MARÍTIMO DE CABOTAJE POR TIPO DE CARGA
AÑO 2022 (CANTIDADES EN TONELADAS MÉTRICAS)
PUERTOS TIPO DE CARGA
TOTAL %
ORIGEN DESTINO GENERAL GRANEL LÍQUIDO
Otros Puertos 102.758 - - 102.758
Tierra Del Fuego
Subtotal 102.758 - - 102.758 0,80%
Otros Puertos 6.135 - - 6.135
Puerto Williams
Subtotal 6.135 - - 6.135 0,05%
Puerto Montt 123.466 - - 123.466
Otros Puertos Sur
Subtotal 123.466 - - 123.466 0,96%
Arica 1 - 87.240 87.241
Iquique 24.860 - 414.116 438.976
Mejillones 317.587 - 2.207.433 2.525.020
Antofagasta 2.000 - - 2.000
Hanga Roa / Isla de Pascua 54.485 - 11.702 66.186
Huasco - 31.650 - 31.650
Valparaíso 85.389 32.993 28.208 146.590
San Antonio 188.700 141.065 136.969 466.734
Lota 6.618 - - 6.618
Calbuco 246.936 9.043 178.430 434.409
Castro 20.563 - - 20.563
Otros Puertos Chonchi 10.254 - 1.041 11.295
Chaitén 125.982 - - 125.982
Quellón 439.063 - - 439.063
Puerto Cisne 152.541 - - 152.541
Melinka 78.918 - - 78.918
Puerto Aguirre 2.220 - - 2.220
Lago Gral. Carrera 382 - - 382
Puerto Baker 3.412 - - 3.412
Punta Arenas 190.440 5.244 246.829 442.514
Puerto Williams 13.819 - - 13.819
Tierra del Fuego 186.508 - - 186.508
Subtotal 2.150.678 219.995 3.311.969 5.682.642 44,34%
TOTAL 4.882.754 659.890 7.274.726 12.817.370 100%
Nota: Los datos informados en Cabotaje, consideran las copias de guías y facturas de embarque de cabotaje, que hacen llegar los embarcadores
a las Autoridades Marítmas del país.
Tambien considera informaciones entregadas por las Agencias de Naves, Empresas Navieras, Ministerio de Transportes y TT., y las Capitanias de
Puerto.
CABOTAJE
PÁGINA 56